Should You Trust a Ranking Number? Limits of Public Metrics
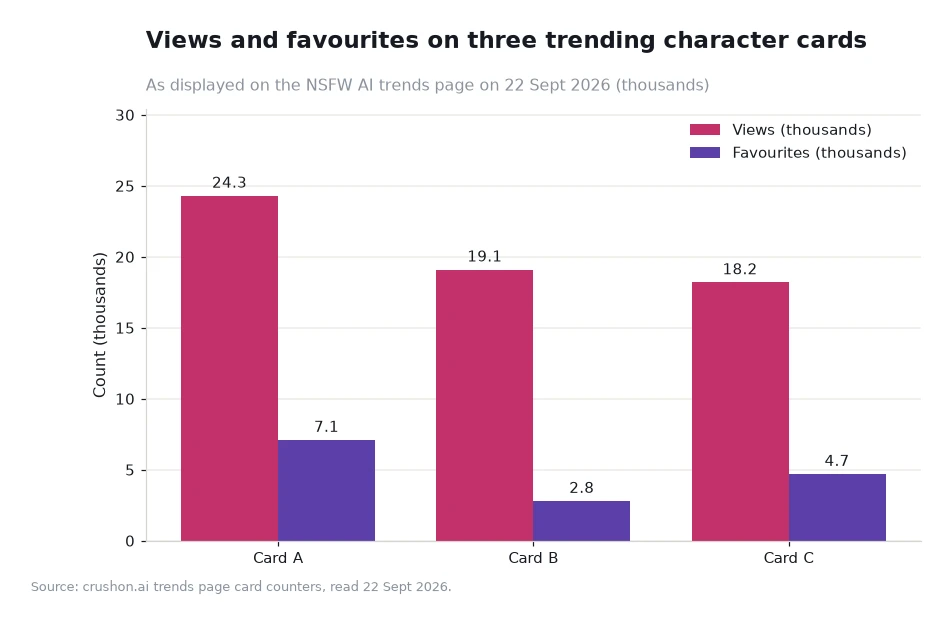
A ranking number is a real measurement of something narrow, and most arguments about rankings come from reading it as a measurement of something broad. The counters on a chart card — 24.3M views and 7.1K favourites, for example — were read on 22 Sept 2026 and are honest figures. What they cannot do is tell you how a card compares on quality, because they were never designed for that.

Key takeaways
- Counters accumulate; ratios compare. 7.1K favourites against 24.3M views is about 0.029%.
- Both figures are rounded, so the honest statement is a band: roughly 0.0290% to 0.0295%.
- A 20-slot list is a sample, and the strength of the sample does not carry over to cards that never appear.
- Because the order only moves on Thursdays, any number you read midweek is at least a few days old.
Cumulative counters versus comparable rates
View and favourite counts are cumulative. They only ever rise, and they hold no information about when the activity happened. A card that collected its 18.2M views over three years and one that collected them in six months display the same number, and the card itself gives you no way to tell the two apart. This is not a flaw in the counters; it is a limit on what a single total can express.
Ratios recover part of the missing context because they cancel out scale. Favourites divided by views asks a narrower and answerable question: of the people who looked, what proportion took a deliberate action. On the figures read on 22 Sept 2026 the answers are about 0.029% for the leading card, 0.015% for the second and 0.026% for the third. Those are small numbers, and that is the point — a deliberate save is rare, which is what makes it informative.
Rounding, and why a band beats a point estimate
Published counters are rounded before they are displayed. A figure printed as 7.1K could be anywhere from about 7,050 to 7,149, and 24.3M could be anywhere from about 24,250,000 to 24,349,999. Dividing the extremes gives a range rather than a single value, and reporting the range is the more honest move.
For the leading card that range is roughly 0.0290% to 0.0295%. For the second card it is about 0.0144% to 0.0150%, and for the third roughly 0.0255% to 0.0262%. The important detail is that the third card's entire range sits above the second card's entire range, so the ordering on that measure survives the rounding. Not every comparison will be that comfortable, and a difference of a few hundredths of a percentage point between two cards should be treated as a tie rather than a finding.
Selection effects and the twenty-slot window
A list of 20 NSFW AI characters is a sample drawn from a much larger catalogue, and selection effects apply to it exactly as they do elsewhere. Cards that appear are the ones that already accumulated engagement, so the list systematically shows you the top of a distribution and never its middle. Reading it as representative of the whole catalogue is the most common statistical mistake made with trend pages.
Ranking also compresses. Positions one and two may be separated by millions of views or by a few thousand, and the ordinal position reports neither gap. When two adjacent cards look like rivals, check the underlying counters before accepting the implied comparison, because the gap is often small enough to be noise.
One more limit is worth stating plainly: these counters describe attention, not satisfaction. A high view total could mean a card was opened by many readers once, or by fewer readers repeatedly, and the displayed figures do not separate those two cases. That ambiguity is not a reason to ignore the numbers. It is a reason to treat them as a weak signal that grows stronger when you also read the card, its tags and a handful of replies for yourself.
| Figure | What it supports | What it cannot support |
|---|---|---|
| 24.3M views | That a card has been opened widely and repeatedly | When that happened, or whether viewers stayed |
| 7.1K favourites | That a meaningful number of readers acted deliberately | How many of those readers returned afterwards |
| 0.029% ratio | Comparison between cards of different sizes | Quality, or any ranking between close neighbours |
| Position one to twenty | Order of accumulated engagement this week | The size of the gap between neighbouring cards |
| Weekly refresh | That the order is recent, having been rebuilt on a Thursday | Anything about the six days since it was rebuilt |
Worked example: putting error bars on a ranking
Take the leading card. Its views are displayed as 24.3M and its favourites as 7.1K. At the low end of both rounded values, 7,050 ÷ 24,350,000 = 0.02895%. At the high end, 7,150 ÷ 24,250,000 = 0.02948%. The centre estimate, 7,100 ÷ 24,300,000, is 0.02922%. All three round to about 0.029%, so for this card the rounding changes the reported figure very little.
Now do the same for the third card, displayed at 18.2M views and 4.7K favourites. Low: 4,650 ÷ 18,250,000 = 0.02548%. High: 4,750 ÷ 18,150,000 = 0.02617%. Centre: 4,700 ÷ 18,200,000 = 0.02582%. Compare that band with the second card's 0.01436% to 0.01496% and the two intervals do not overlap at all. The ranking by keep rate is therefore defensible, while a ranking between two cards separated by only a thousandth of a percentage point would not be.
Reading the published list without over-reading it
The list is at https://crushon.ai/trends/nsfw_ai, and treating it as a starting point rather than a conclusion is the whole technique. Use it to find candidates, then read the counters yourself, then test one or two cards directly. A card that survives that sequence has earned its place in your shortlist; one that only survived the ranking has not.
Two habits keep the numbers honest. Record the date you read them, because an undated counter is uninterpretable once the list refreshes on Thursday. And when two values are close, write down both rather than the winner, since a table of two numbers is a better record than a memory of one position. Readers who want more breadth than 20 entries can use the tag search rather than arguing with the ranking about what it omitted, and a different cut of the same data is available on the weekly rankings boards.
Frequently asked questions
Are the view and favourite counters accurate?
They are accurate as reported and rounded as displayed. The honest reading is a range: a card shown at 7.1K favourites from 24.3M views sits somewhere between about 0.0290% and 0.0295%.
Can I compare a card on a ranking list with one that is not listed?
Only if you have counters for both. The ranking tells you nothing about unlisted cards, and the raw counters are the only common measure available across listed and unlisted entries.
How much does the weekly refresh change things?
It changes the order, not the totals, because counters keep accumulating while positions are recalculated. A card can move down the list while its own numbers continue to rise.
Use numbers as evidence, not as authority
Read the counter, compute the ratio, state the band, and note the date. That sequence turns a public metric into something you can defend, and it takes about two minutes per card. Where the arithmetic leaves a genuine tie, say so and choose on something else — a tag that fits, a premise you like — instead of manufacturing a distinction the numbers do not support.
Data and sources: counters and ranking labels displayed on the Crushon trends page[1], read 22 Sept 2026. All percentage ranges are arithmetic on those rounded figures. The comparison method is editorial advice rather than platform data. Meant for adult readers of 18 and older.